Gamifying Train Commutes
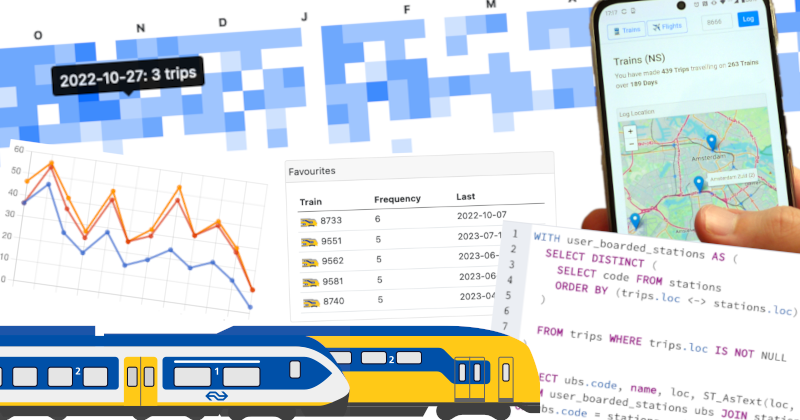
Last year, I began logging train trips as a means of gamifying and collecting data on trains encountered on journeys in order to make commuting a bit more interesting. This post explores some data insights from a year of travelling by train, and the implementation & architecture of the logging and analytics system.
Background
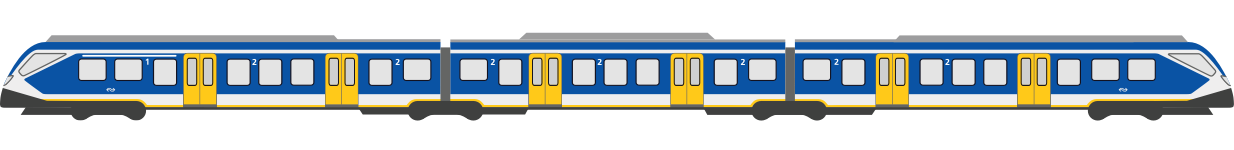
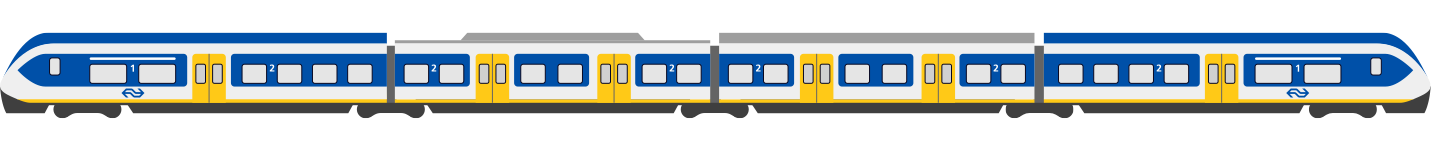
NS is the primary train operator in the Netherlands. Each of their trains has a materieelnummer or treinstel identifier displayed on the train exterior and interior. It can be used to uniquely identify the train and determine the train type. For example 2401 with pattern 24xx identifies a 4-carriage train in the Sprinter Lighttrain (SLT) family.
The two datapoints logged on boarding each train are the current date/time, and this identifying number. Over 12 months, 439 trips were logged, on 263 unique trains on 189 different days.
Implementation
A small logger webpage for mobile & desktop was created. This makes it easy to add log entries on the go. The page doubles as an analytics dashboard, with many of those visualisations recreated here. Charts on the frontend use Chartjs. On the backend, a PostgreSQL database stores the log entries. A small Python Flask app provides the API: an interface for analytic SQL queries and data entry. This is hosted on Azure as a free-tier static webapp, with the API running as part of an HTTP-triggered Azure function.
Gotta catch ‘em all
Comparing the type of the logged trains with data available online about the composition of the NS fleet (for example on treinenweb.nl), we can estimate how much of the fleet has been encountered, broken down by train family, and how many trains are still left to “catch”:
| Train Family | Ridden/Total | % | ||
|---|---|---|---|---|
 |
VIRM | 131/177 | 74% | |
 |
DDZ | 30/56 | 54% | |
 |
ICM | 68/205 | 33% | |
 |
SNG | 22/206 | 11% | |
 |
SLT | 4/62 | 6% |
The majority of trips are commuting between cities, accounting for a higher proportion of Intercity (VIRM, DDZ, ICM) class trains encountered. On these particular routes, VIRM is the most frequently employed rolling-stock type.
ICR family trains (in use for example on IC direct & international routes) are not shown here, as I did not find a reliable source for the in-service trains in this family.
Will I see you again?
Looking at each individual train we could ask: how often was the same train encountered in the last year, and which trains were encountered most often?
| Favourite Train | Count |
|---|---|
| 8733 |
6 |
| 9551 |
5 |
| 9562 |
5 |
| 9581 |
5 |
| 8740 |
5 |
Of the 263 trains ridden, 153 (58%) were seen once, with the other 110 (42%) seen on 2 or more different trips.
There were 4 occasions the same train was caught on different trips on the same day (e.g. catching the same train in the morning as in the evening).
8733 wins favourite train award not only for most often ridden in the last year, but also for longest streak – consecutive days with journeys a train. 8733 appeared on 5 consecutive days, at different times of day, between 12/09/22 and 16/9/22. The next longest streak was only 2 days.
No rest for the wicked
A heatmap of trips by day and time of day reveals traveller patterns:
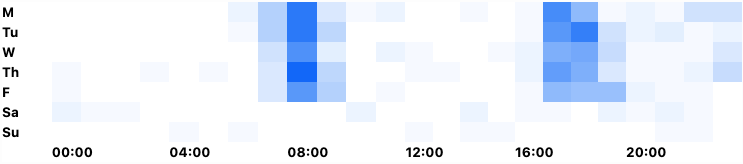
The two darker bands show weekday commuting windows. The darker, tighter morning band can be explained by travel behaviour – I tend to take a direct train in the morning, whereas the band in the evening is wider from taking a route requiring a change on the return trip. The early morning trains show some use of the nachttreinen running special routes.
Trends
How does the number of new (previously unencountered) and unique trains compare over time?
As a percentage of all trips, the number of unique trains encountered fluctuates between 80-100% each month. The fall in % new trains each month can be explained: as more of the fleet has been encountered, the chance of riding a new train will decrease.
Geolocation
For a long time only two datapoints are logged – the train id and the log date. This already makes for some interesting insights. A few months ago I started logging also the log geolocation, using the web geolocation API to send from the browser, and the PostGIS extension for storing and querying geographic data from within Postgres.
The raw log location is added as a column loc with geography type to the trips table. A static data table stations lists the station code, name & geographic location.
This example query below lists the unique stations the user has boarded from, by matching the raw log location to the geographically closest station. The <-> operator gives the spherical distance between two geographic points.
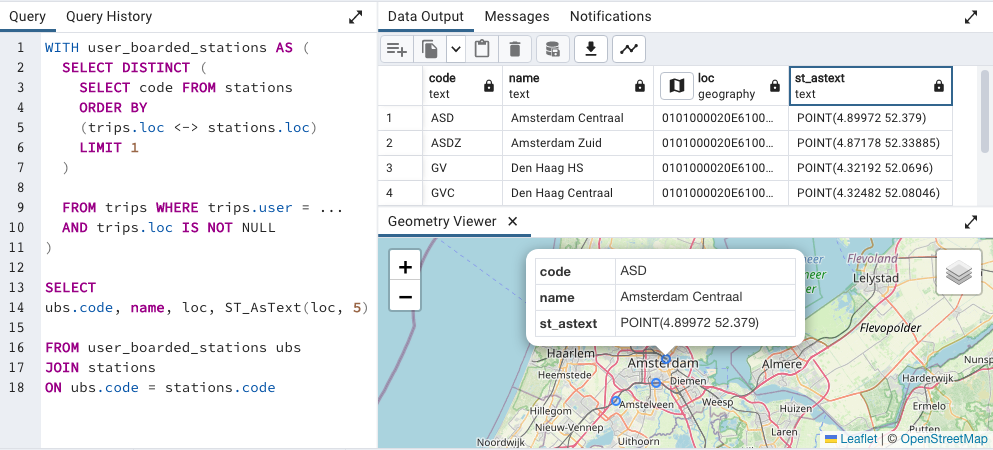
In the output above, the point in the geographic loc column is shown in Well-known Binary representation. The Pgadmin tool has a neat feature of being able to view geographic features directly within its user interface.
Route Information
A treinserie identifies a certain train route. For example the 2800 series describes the route:
2800 Intercity (NS) Rotterdam Centraal – Gouda – Utrecht Centraal
Every scheduled train journey is associated with a ritnummer identifier for a scheduled journey, independent of the physical rolling-stock employed. This is related to the treinserie in that the ritnummer without last 2 digits gives the treinseries. Odd numbers describe journeys in one direction, and even the other.
While it isn’t usually shown on the train or station boards itself, it is visible within the NS-app. But this isn’t convenient to lookup and enter each time when logging journeys.
Instead, the NS API provides a lookup service to convert a materieelnummer, the train identifier already being logged, to a ritnummer. So it is still only necessary to log the first field, while the backend can cross-reference with the NS API to get the ritnummer and hence store route information for the current trip.

